Home prices are the holy grail in real estate, and it almost seems sinful or off-limits to say they’re going down. But let’s be real. That’s what is happening right now locally and in some other portions of the country. Let’s talk about what this means as well as what’s going on in appraisal reports.

UPCOMING (PUBLIC) SPEAKING GIGS:
11/15/22 Sacramento Bee Q&A at 12pm (RSVP here)
11/17/22 Fair Housing Lunch & Learn (details TBD)
1/18/23 WCR Market Update in Cameron Park (details TBD)
1/19/23 Big market update at SAR on Zoom (details TBD)
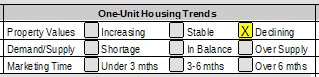
YES, THERE IS A BOX
If you didn’t know, there is a box on appraisal reports where appraisers can state property values are either increasing, stable, or declining. Here’s what the box looks like. I’ve been hearing about some appraisers checking the declining box lately and others not. It’s a mixed bag (rightly so).
THE MARKET ISN’T THE SAME EVERYWHERE
It’s really important to note the market is NOT the same in every location and price range across the country, so appraisers aren’t going to be checking the same box everywhere. Even in a local market, it’s possible different locations or property types are not experiencing the same trend. I mean, all ships tend to rise and fall with the tide, but we have to let the research do the talking instead of imposing a declining narrative on every portion of the market.
YES, THE MARKET IS DECLINING
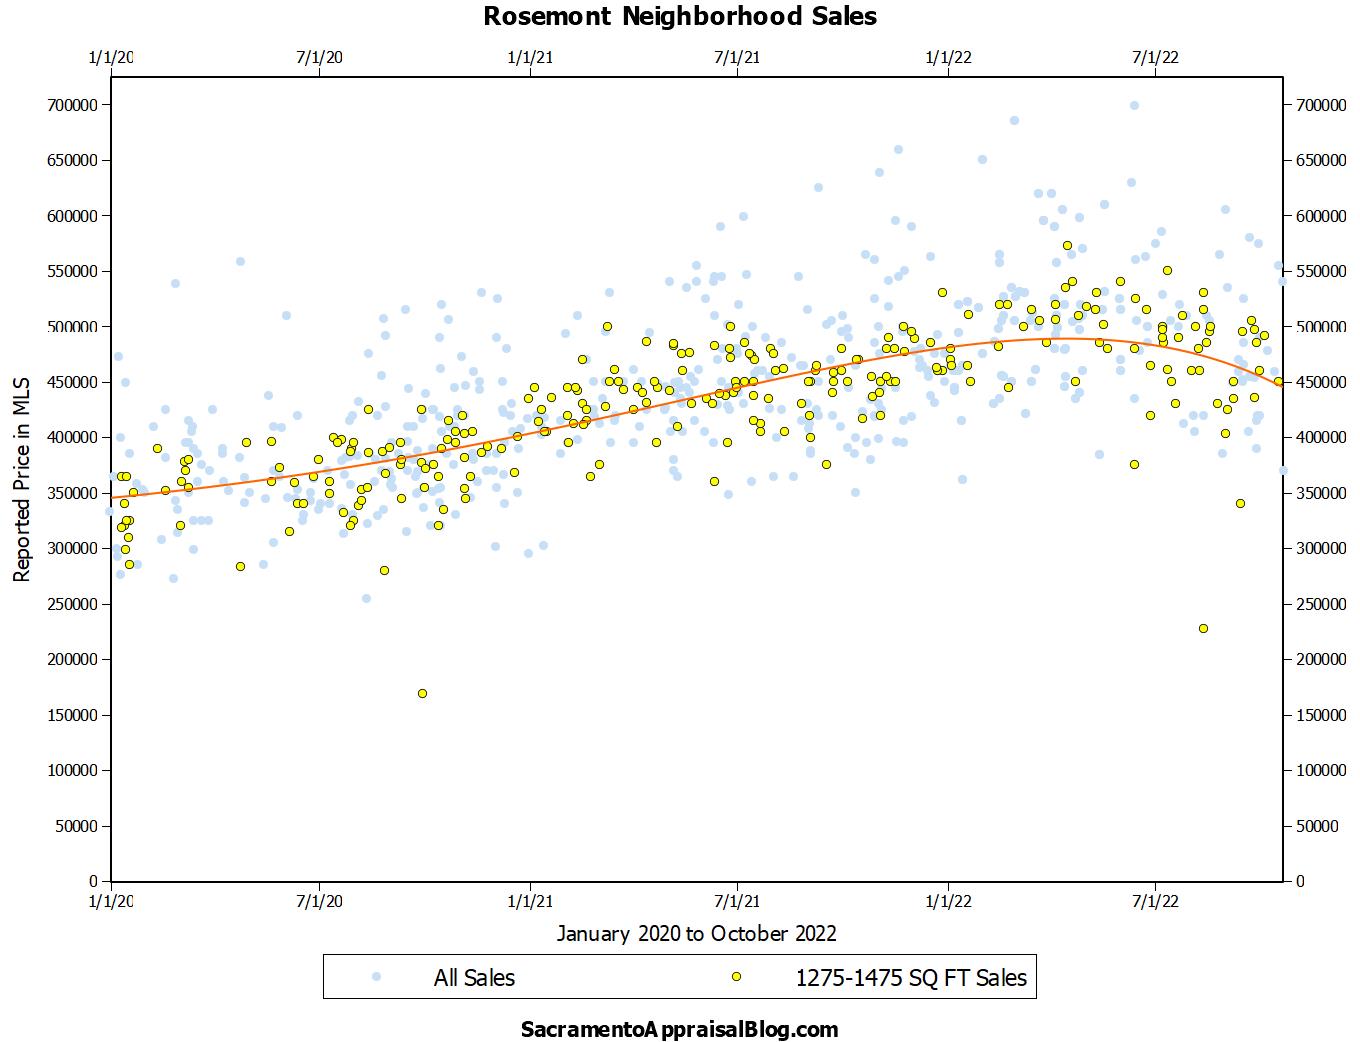
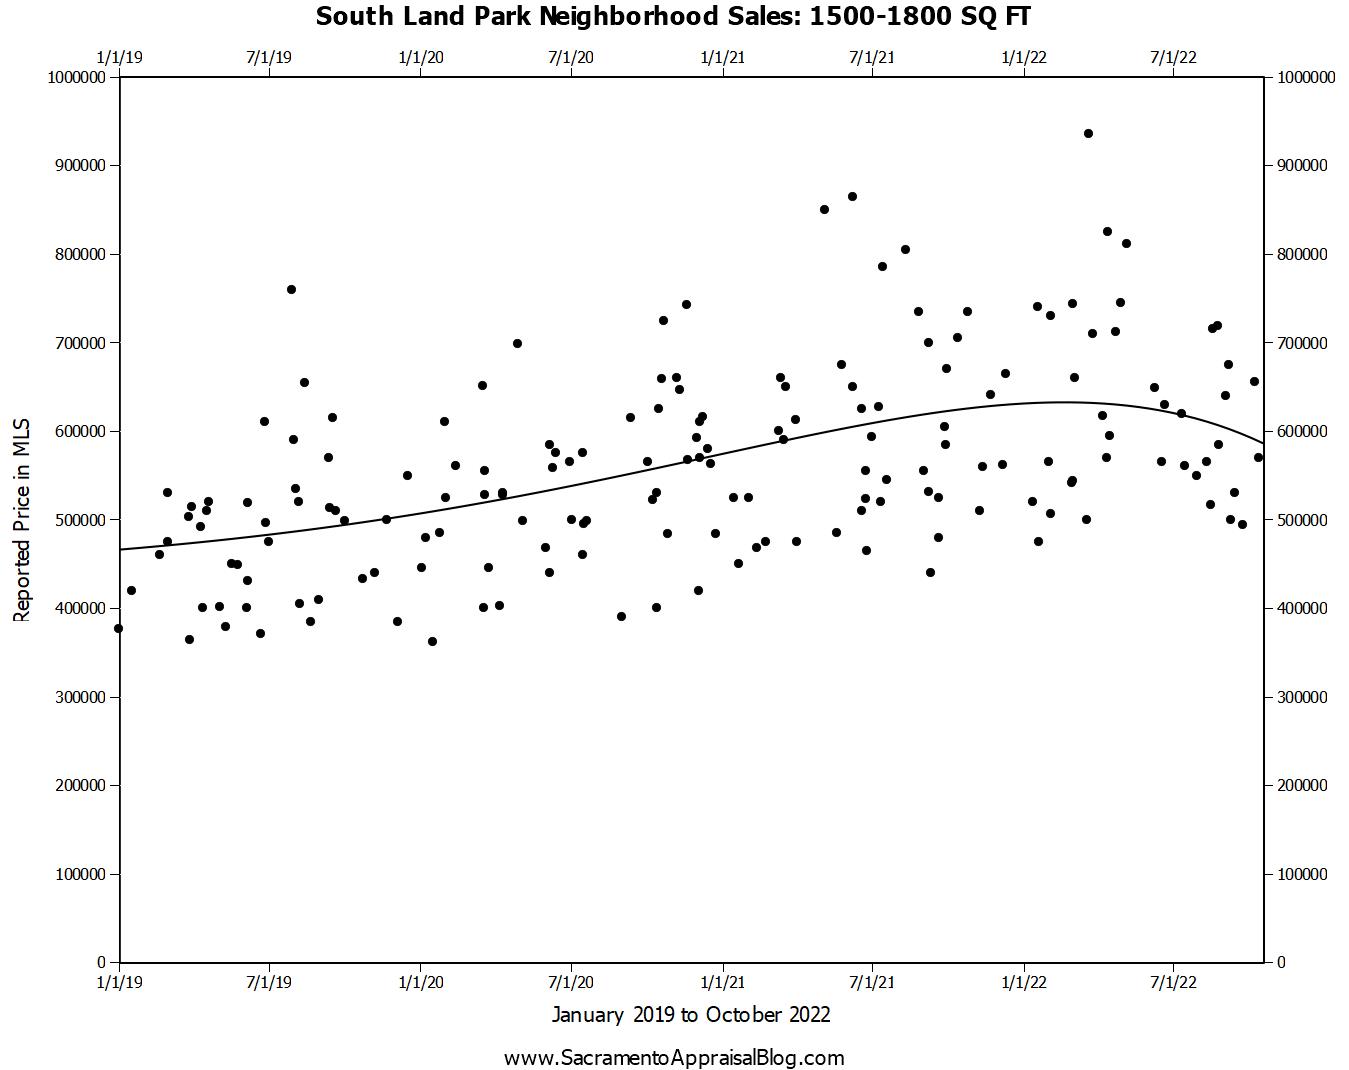
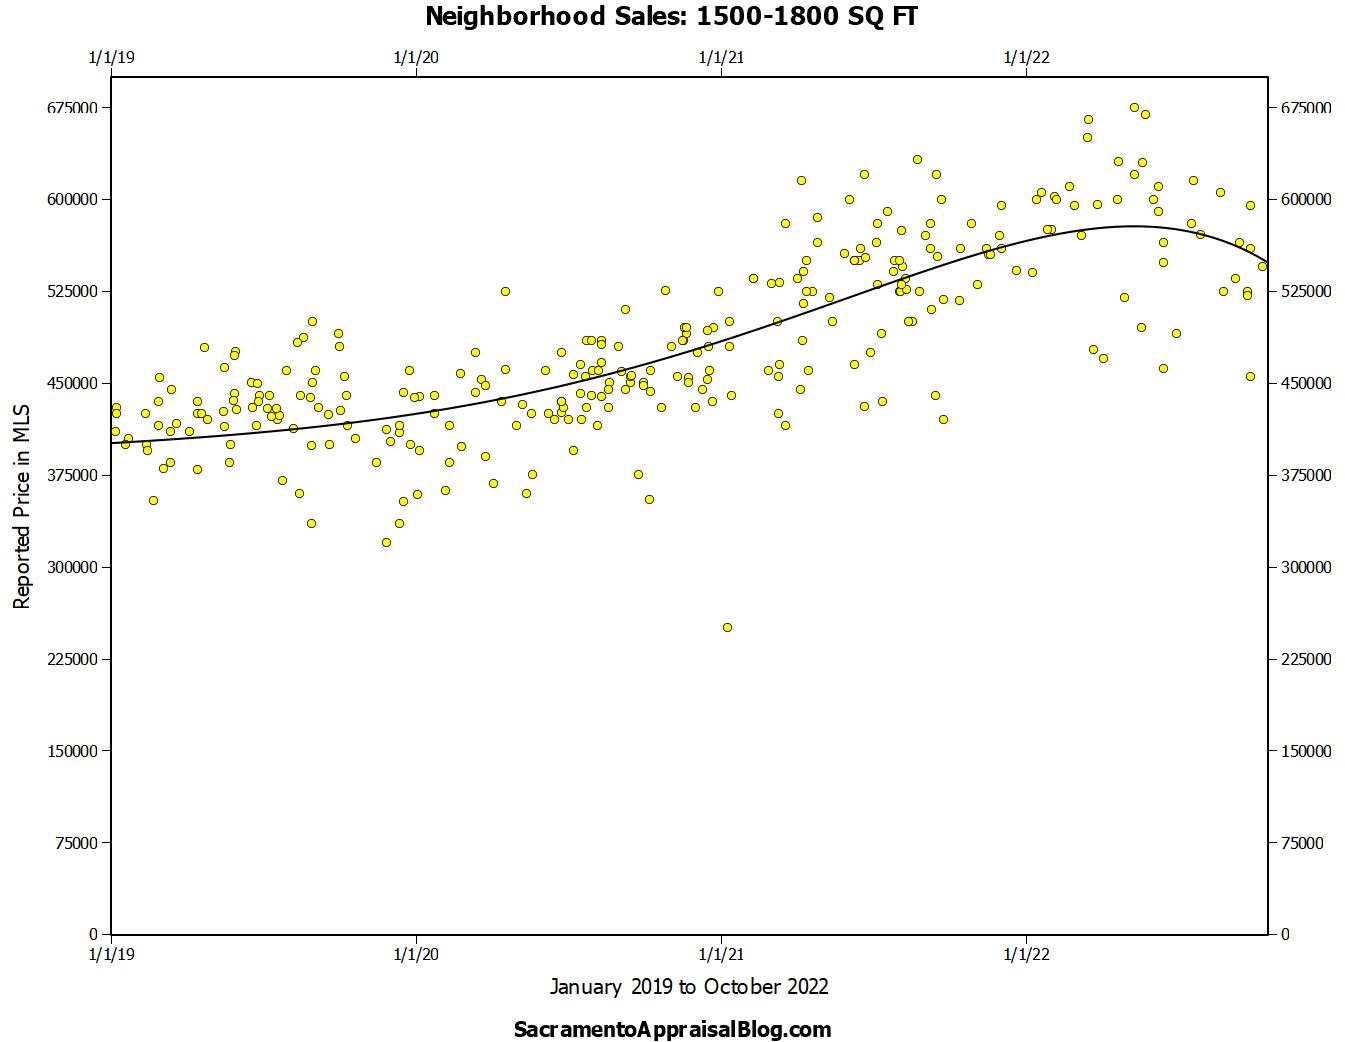
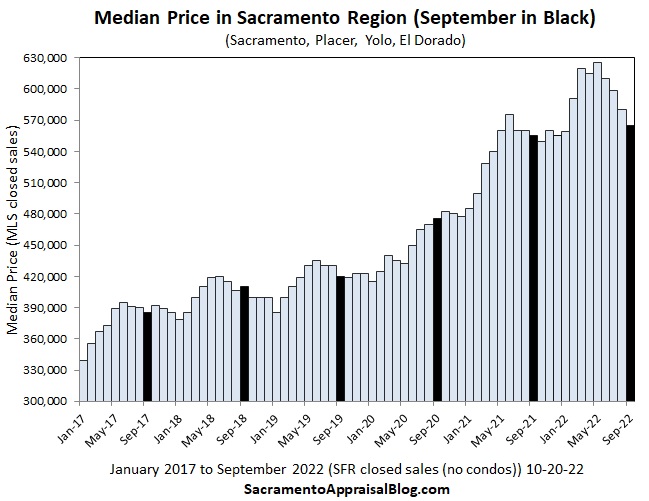
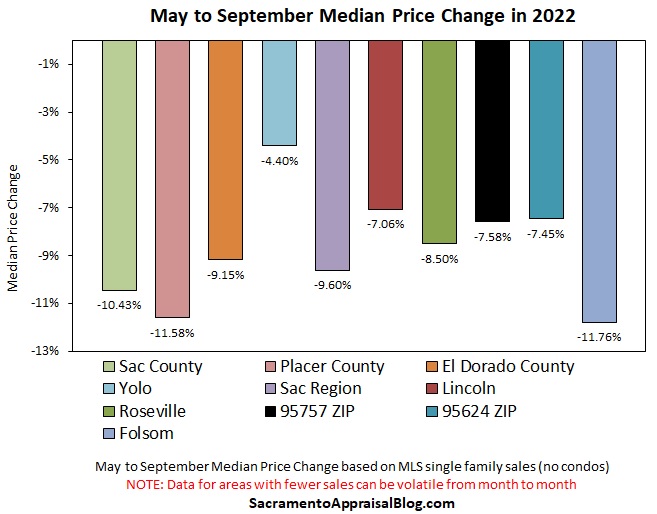
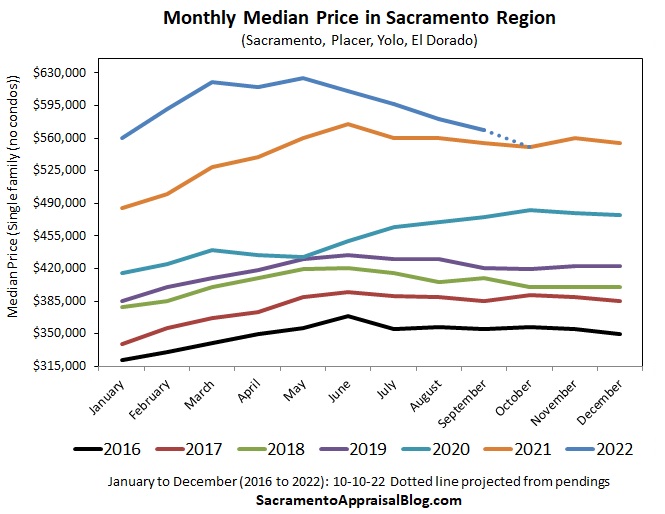
In Sacramento, prices have clearly been declining as demand has changed sharply in recent months. In other words, buyers are hands-down paying less today than they did in previous months. We see this in lots of metrics I’ve been writing about for months, and even neighborhood graphs are finally starting to show a declining trend (it takes a bit for graphs to have enough data to show the trend). This is more than a modest seasonal dip as the median price is down about 10% right now since May. In a normal year we might see the median price down about 3-3.5% at this time of year. A few weeks ago I talked about the median price being very close to dipping below last year, and even Redfin is starting to show that for Sacramento (see this thread).
Example 1: Neighborhood Graphs
Example 2: County, City, & Regional Stats
BRO, THE MARKET IS JUST STABILIZING
To me the word “stabilization” is a bit rosy because price declines have been much more intense than usual. Stabilization or normalization would maybe resemble a more seasonal trend or a leveling off, but what we’ve experienced lately has been a sharp drop in buyer demand. Most counties are down in sales volume by about 25-30% over the past few months compared to recent years, so this has been a bigger shift in demand rather than a typical seasonal change.
BUT PRICES ARE STILL UP FROM LAST YEAR
Yeah, prices are technically up from last year when looking at September stats, but there is a clear declining trend happening right now too. It’s sort of like if I lost 70 pounds and then gained 20 back. I’m still down 50 pounds technically, but do you know what the real trend is? It’s me gaining weight lately. And just to be clear, I’m not sharing real stats from my body even though I have gained 20 this year. Haha. I’m just saying it’s a mistake to focus on year-over-year prices to the point of missing what is happening in front of us right now.
BUT WE NEED MORE DATA
How many months of data are needed before we can establish a trend? I’m not sure there is a specific answer that applies to all situations, but I would say having almost six months of slower data now is more than enough. I think we probably needed half or more of that to start seeing a clear trend. Even by June we knew volume was starting to take a 25%+ hit, so we knew there was a sharp change at hand. It just takes time for the trend to show up in actual prices to be able to make the call as to what is happening. It’s okay if you think we still need more data, but let me ask you this. What more do you need? I’d love to hear in the comments or an email (not interested in hate mail though).
Q&A HOUSING VIDEO I DID
I recorded a video with YouTuber Jeb Smith to talk about dynamics in today’s market. This was recorded about two weeks ago, and it’s all off the cuff (my favorite way to do things). Watch here or below.
THERE IS STILL COMPETITION
Prices are going down because affordability has taken such a beating lately. It’s that simple. In recent months mortgage rates have changed faster than they have in forty years, so it’s not a shocker to see a quick change with prices. Do you know what would be shocking? To not see a change. But remember, declining prices doesn’t mean there isn’t any competition. It’s a mistake to say all buyers have left the market because that’s statistically not true. Keep in mind about 36% of pendings over the past two weeks in the region had multiple offers per MLS stats. Also, while we’ve seen about 3,600 fewer sales happen since May of this year, there have been nearly 11,000 sales that have happened. In other words, declining prices doesn’t mean the market has stopped. Bottom line.
NOT LOCKED INTO ONE TREND FOR SIX YEARS
The trend is declining right now, but that doesn’t mean we’re automatically locked into this one trend from here on out. It also doesn’t mean we won’t see some spring seasonality ahead either. When the market drops in Sacramento, it’s not uncommon to see about five or six years of a downward trend, but I’d be careful about stating we’re locked into that. Maybe. Maybe not. Keep in mind it’s not a sharp plunge for an entire downward cycle either. Ultimately, the verdict is still out on the future since we are just at the beginning of change, but right now prices are dropping in light of such a huge hit to affordability lately. In a sense it feels like a game though where the Fed could manipulate things and change the trajectory of the market. So, if rates go down sharply, that could alter the dynamic. Some like Ivy Zelman predict it’s possible for the housing market to move faster now in light of access to real estate data like never before, but that’s also to be determined.

WE NEED 12 MONTHS OF DATA TO SAY IT’S DECLINING (FALSE)
Sometimes I hear appraisers say we need twelve months of data before calling something a trend, but why twelve months? And to play devil’s advocate, when values started to really turn up in the summer of 2020, did we need to wait 12 months until we said the market was increasing? Absolutely not. In short, we do not need twelve months before making a call for the direction of the market. If that was the case, then appraisers would perpetually be far behind the trend in an increasing market and a declining market.
NATIONAL vs LOCAL
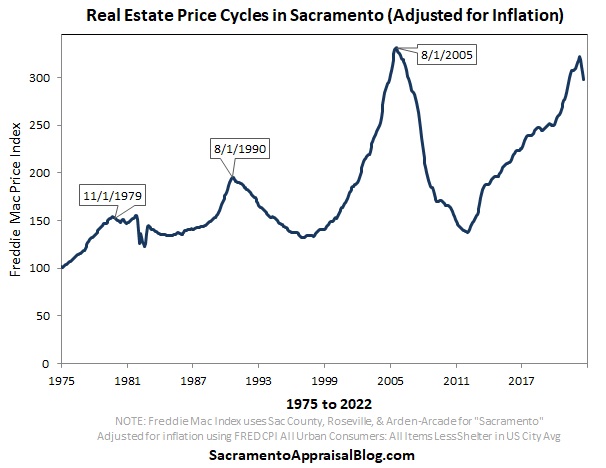
It doesn’t matter what the “national” housing market is doing because the so-called national market is really made up of thousands of local markets. Some experts project a declining trend that will start in 2023, but that means nothing for Sacramento and so many other locations. Remember, homes prices fell maybe 30% in some markets during the previous housing downturn (and far less in some areas), but the median price dipped by 59% in Sacramento County. This just goes to show a national projection or trend doesn’t mean squat for the local market.
DOES THIS MEAN APPRAISALS WILL BE COMING IN LOWER?
Just because the market is declining doesn’t mean every appraisal is going to be coming in below the contract price. Lately it’s been a mixed bag and there are lots of appraisals still coming in higher according to conversations with loan officers. I have definitely heard of lower appraisals, but that’s not a bad thing (unless the appraisal was deficient). An appraisal below the contract price could have been a deathblow to a transaction in 2021, but hopefully today it’s more of a bargaining chip (sounds healthier to me).
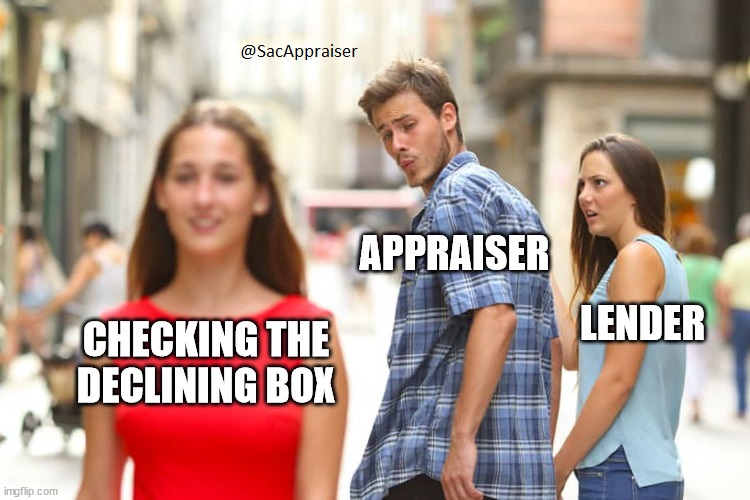
THE MARKET LOOKED “STABLE ON THE DAY”
I recall when the market was tanking in 2007 hearing some appraisers say they’d check “stable” because “the market was stable on that day.” This was basically to appease lenders at the time who pressured appraisers not to check the declining box. This is not legit though because appraisers are tasked with being a neutral party to the transaction, which means showing bias like this to clients is off limits. Besides, if an appraiser is not identifying the trends correctly, that could show up in adjustments that are not given to the comps, right?
DUDE, IT’S JUST A PERSONAL OPINION
A local loan officer told me an appraiser said it’s just a personal opinion as to whether this declining box is checked or not. I mean, I can understand the sentiment since there isn’t a rigid list for what appraisers need to identify before saying a market is declining. Thus, there really is an element of subjectivity here. But this is where the appraiser has to be the expert by considering all relevant issues and diagnosing the trend based on research, stats, and observations. In other words, this little box to check should be backed by stats and support for the conclusion. If it’s just a checked box without support, then the appraiser hasn’t done his or her job.
Okay, that was probably more than you wanted to read…
ADVICE FOR COLLEAGUES
1) Be the expert in your market by being on the cutting edge of the trend.
2) Reflect the market and support your conclusions. If you feel afraid a client won’t keep you around if you say the market is “declining,” that’s not a good client. But also, if we start to get more robust stats from big data companies that the market is declining, you’ll be really behind the trend if you’re saying it’s NOT when everyone and their mom knows it is.
3) If you don’t know how to measure prices, talk to colleagues and get up to speed as quickly as you can. Take a class, scour the internet, try to add some new skills to your bag of tricks.
4) Take the time to unpack the market in each appraisal report. I honestly don’t care which box you check, so there is no pressure from me. But support the trends you say exist with some commentary and rationale.
5) If you aren’t making scatter graphs like my neighborhood ones, maybe it’s time to figure that out (or use some other type of graph). I have some free graph tutorials in case it’s helpful.
Thanks for being here.
MARKET STATS: I’ll have lots of market stats out this week on my social channels, so watch Twitter, Instagram, LinkedIn, and Facebook.
Questions: What stands out to you most above? What did I miss? I’d love to hear your take.
If you liked this post, subscribe by email (or RSS). Thanks for being here.